This is about a serious issue that I believe many people aren’t understanding. Now, again, I stress that I’m not a physician. I’m also not an epidemiologist, who specializes in the study of the spread of disease. I’m physiologist. I have some understanding of immunology, microbiology and other related fields that are pertinent to the current situation.
I’m not an expert in these areas, but I have some knowledge that might help people understand things. Everything I will relate here is factual, to the best of my knowledge. If anyone finds anything that is incorrect, please let me know ASAP and I’ll correct it.
My previous article was a sort of general primer on the SARS-CoV 2 virus and the COVID-19 disease which it causes, along with some basic Microbiology. I’m going to go a little further with the immunology now, because it’s become more relevant with some issues of viral spread that have popped up in the last couple days.
As of right now, there are about 512,000 worldwide cases of coronavirus infection that are reported in the general media. There have been about 24,000 deaths. In the US, there have been more than 80,000 cases reported in the media, with about 1200 deaths. Over half of the cases of the US are in New York state, with the majority of those cases located in New York City. Most of the rest of the cases are in New Jersey, Washington state, and California. There are, however, confirmed cases in all US states.
This distribution of infections have some people thinking that this pandemic will remain centered in the cities and the populated areas of the coasts. They are also thinking that “flattening the curve” means there will be fewer infections and that if infection rates can be held low for a couple weeks, then we can move back to “normal life”. These perceptions are all incorrect.
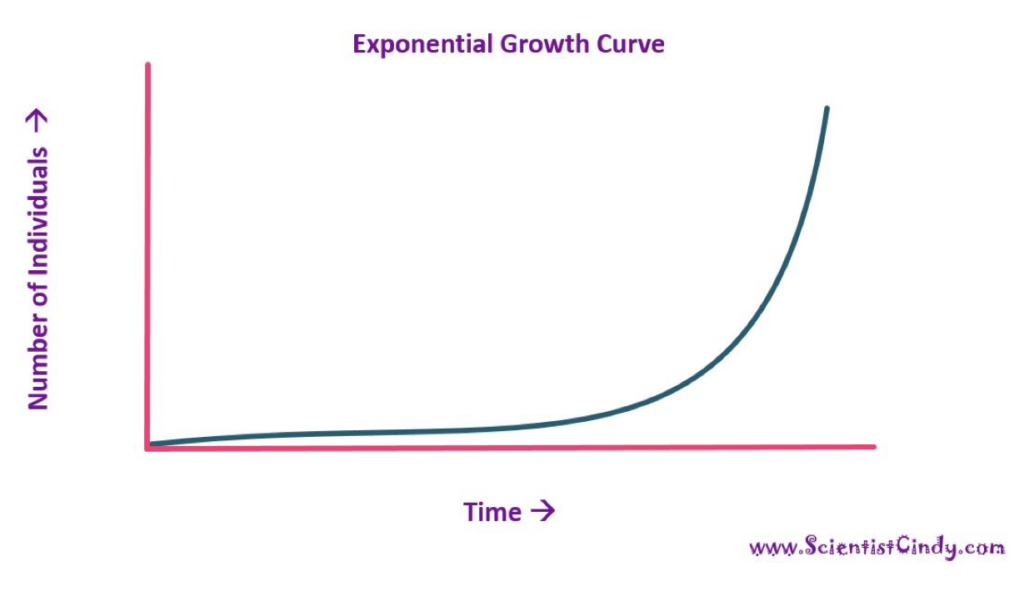
First, the relative explosion of infections we are seeing in New York City is a function mostly of population density and air traffic. Think of a REALLY contagious infection, like measles. It is so easy to catch measles that one infected person is likely to infect 15 others before they get better and are no longer infectious. Someone with SARS-CoV 2 will infect 2 to 2.5 people before they are no longer infectious. If you take a person with measles and put them in a football stadium with 9 other people, it’s likely that none of the other 9 will be infected, if they all sit still. After a few days, the person with measles will either get better or die and everyone can go on about their business. If, however, the 10 people in the stadium are wandering around, eventually, one of the nine uninfected people is going to be infected by the first case. Now, we have two people in the stadium with measles. If they keep wandering around, one or both of the sick people will run across some of the others and then there will be three or four infected. This second round of infections will happen sooner than the first, because there are two infected people wandering and twice as many opportunities for the virus to spread. Now there are four people infected. In a little while, those four will encounter some of the remaining six healthy people and then there will be 6 or 8 infection. You get how this goes. This is an example of an exponential process, where 1 becomes 2, 2 becomes 4, 4 becomes 8, and so on.
Now, consider the same situation, one person with measles and 9 healthy people. Put all ten of them in a passenger van. In about half an hour, all ten are likely to be infected. This all assumes no one has been inoculated against measles, obviously. They would be immune. Remind me to explain the concept of “herd immunity” sometime and why vaccination is so important.
Anyway, the ten
people in the van represent the situation in the city. They are all close
together and have many opportunities to interact. This is the ideal situation
to spread and infectious disease. The people in the football
stadium are more like the population of a rural area. Interactions are fewer, so transmission is much slower, but they do occur. If you look at an exponential curve, there is a fairly long, relatively flat segment of the line at the beginning, then it begins to turn upwards a bit, then more quickly, until it is almost straight up. The exponential curve in the van would have a relatively short initial segment and it would turn upwards pretty quickly, hitting the peak (in this case, 10) quickly. The exponential curve in the stadium would have a very long initial phase (the time it took for the initial infection to infect number 2, and it would only turn rapidly upward nearer the end (when the 2 became 4 and 4 became 8, etc.).
This means that it is expected that cities would see higher and faster rates of infection. Some cities are hit sooner than others due to variables like how much traffic they have going in and out, how much tourism, how densely populated they are, and even things like what the weather is like. They will, however, eventually see the same process of disease spread, just a different times and different rates. New Orleans, and the rest of Louisiana, has very quickly become a hot spot, most likely because of Mardi Gras (which should have been cancelled).
The stadium vs. van scenario also demonstrates the value of social distancing. The people in the stadium were demonstrating good social distancing. Extremely good social distancing. The people in the van were not. One person infected 9 others very quickly in the van. One of the things people often don’t grasp is that, in both situations, the number of people eventually infected was the same. It just took much longer in the stadium than in the van. This is the “flattening the curve” phenomenon everyone is talking about when they show that graph of St. Louis versus Philadelphia in the 1918 flu pandemic. The virtue of flattening the curve is to spread out the number of infections over time, so the peak number of infected people doesn’t get rise too high. This allows the number of sick people at any one time to not overwhelm the health care system, meaning that fewer people are likely to die because they can’t get optimal care. If 100,000 people get sick in a week, that is going to be disastrous, because the hospitals won’t be able to care for them and many will die because of it. If 100,000 people get sick over the course of 2 or 3 months, the number of sick people at any time will be manageable and the mortality rate will be much lower.
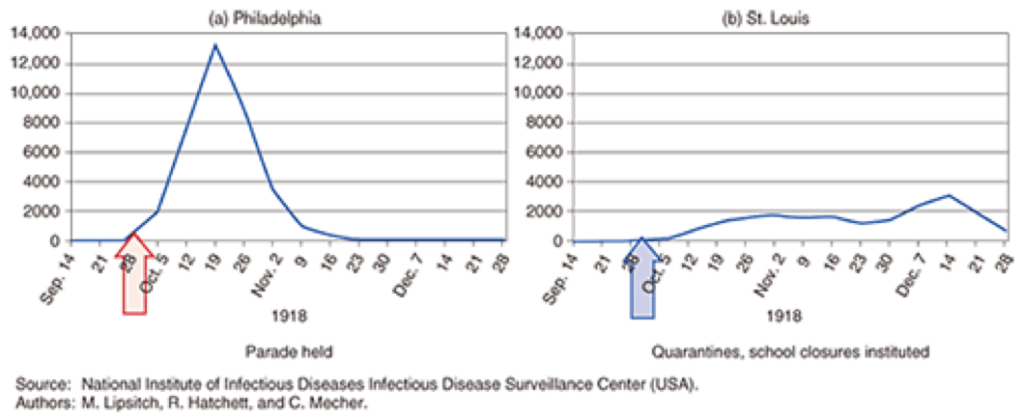
These are the charts of the number of deaths in St. Louis and Philadelphia over the same time span in 1918. The big differences were that St. Louis started taking steps to institute social distancing before they even had a confirmed death. Philadelphia had a war bond parade that drew 200,000 people into the streets. The peak mortality rate in Philadelphia was nine times the rate in St. Louis. Incidentally, the second bump on the St. Louis graph was a result of relaxing precautionary measures too soon.
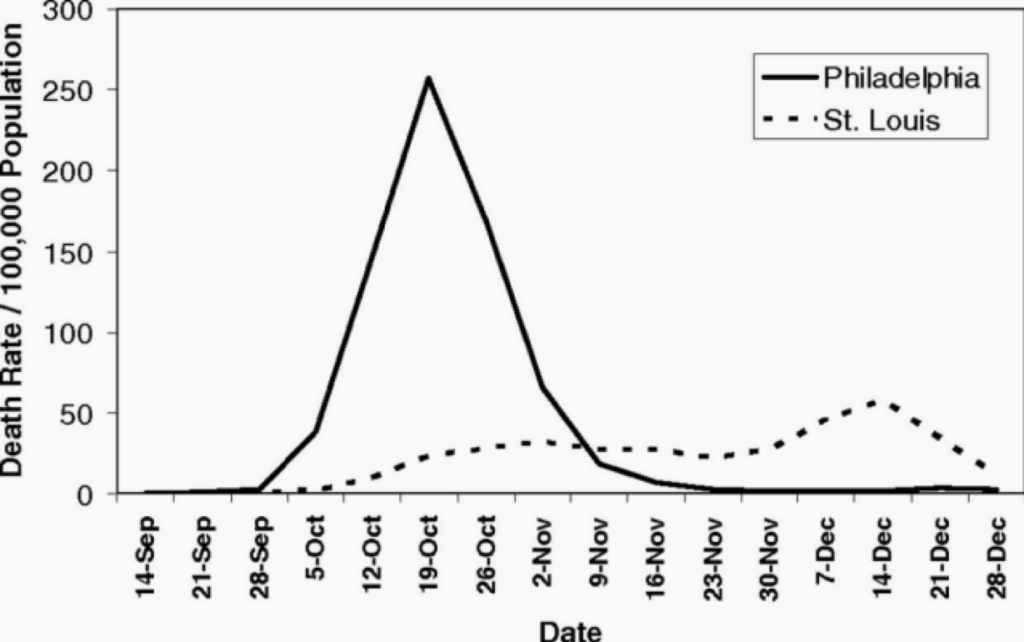
Same data, just superimposed for comparison.
These factors should help you to understand the value of taking steps to prevent the spread of disease, even in rural places and in places that are not currently hard-hit. Fighting an infection is a war, not a battle—a marathon, not a sprint. What is happening in New York today is what will be happening in Chicago next week and Dallas the week after that (for example). The infection rate in less-densely populated will be lower and slower than in cities, but the infections will come and the more interactions people have in those places (like in restaurants and crowded work environments), the faster it will happen. Unfortunately, rural places are often less well able to deal with large-scale medical emergencies than more urban places, so the outcome, in terms of mortality can be worse.
All of this has
happened before. We know, in general terms, how this is going to go. It
happened in 1918. Social distancing works. It’s been proven and demonstrated.
How infections progress is known, given the right data. That is one of the
biggest issues with our current emergency. We didn’t start testing soon enough
to gather the data we need to build precise models of how the coronavirus
infection will proceed. That is improving, but even the data gathering is
adding confusion. The cases currently confirmed by testing isn’t reflective of
the actual number of infections in the population. We don’t even know how far
off they are. This means that you can’t take the number of confirmed cases in,
for instance, Kentucky, and use that to predict how the virus will spread over
the course of the next weeks or months. So, when you see numbers of cases and
numbers of deaths in the news, try to take those numbers in context. If the
number of confirmed infections in New York drops from one day to another, no
conclusions can be drawn. If it goes down for four or five days in a row, and
you make sure you account for different numbers of people tested on one day
versus another, then, maybe you have, at least, a trend.
The moral to this story is to do the right thing. Listen to the experts, not talking heads and random yahoos on the internet. Act like you are infected when you are deciding whether or not you should go out. This is not “just the flu”. Dead people aren’t stacked up like cord wood in ice rinks because the morgues are full during the flu. If we all just act right, remain patient, consider the impact of our actions on others, and follow the advice of people who actually know things, this will pass as quickly and with as few dead people as possible.